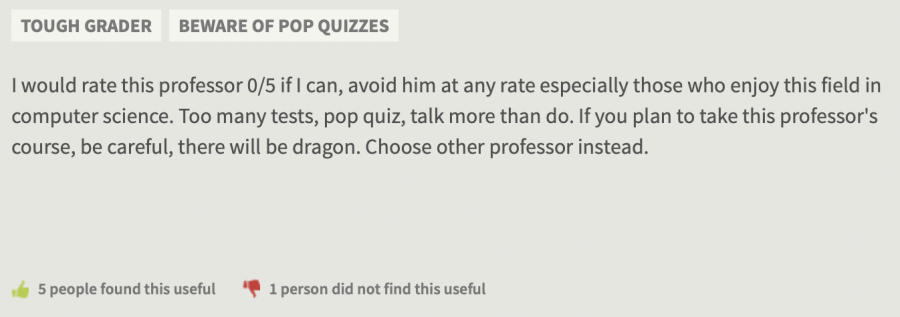
As a college student myself, you would have to hold me hostage with no internet-access in order for me to not check RateMyProfessor reviews before enrolling in any course. If a professor has negative review after negative review after negative review listed with a review saying “I would rate this professor 0/5 if I can, avoid him at any rate especially those who enjoy this field in computer science” (yes, this is an actual review at my university), then I might think twice before signing up for their course.
Yet, it seems other students don’t have this same reliance on RMP as I do, saying such ludicrous statements as “it’s all negative reviews since you’re more likely to leave a negative review than a positive one.” This begs the question… are the reviews on RateMyProfessor inherently more negative than positive? But that seems too easy, so let’s go one step further into my only issue with RMP: do the extensive written comments for each review represent the single number estimates for course quality and difficulty? And just for the fun of it, what is the highest (and lowest) reviewed courses on RMP? It’ll take some scraping and processing, but in just a few minutes, we will have the answer!
A Lot of Web Scraping
Let’s get through the messy logistics first before we can get into the analysis: web scraping. As a quick aside: I used Jake Daniel’s wonderful web-scraping R code template you can read more about here and the Google Chrome tool SelectorGadget found here to make this a bit easier on myself. With that, we’ll start our journey at the RMP professor search page for my university, Illinois Institute of Technology. 
The first web scrape will start here, where we will collect the name, subject, and URL to the reviews page for each professor. One minor challenge was the ability to scrape more than 20 professors and not have to set a single limit to search until (if the limit is 654 today, next semester it could be 672 and we are missing out on those newly-added professors). To do this, we just web scrape the total number of results, make it a multiple of 20, and iterate through each multiple of 20 up to that limit, setting the website offset to this to generate a page of new professors. Here’s my code:
# URL with the offset field at the end left blank - we'll add on to that soon.
url <- "http://www.ratemyprofessors.com/search.jsp?query=illinois+institute+of+technology&queryoption=HEADER&stateselect=&country=&dept=&queryBy=teacherName&facetSearch=true&schoolName=illinois+institute+of+technology&offset="

how_many <- url %>% read_html() %>% html_nodes('.result-count') %>% html_text() %>% as.data.frame()
# we now have a data table with two rows - the first is garbage from the RMP website while
# the second is the actual sentence we want "Showing 1-20 results of ??..."
showing_results <- how_many[2, ] # keep only the relevant sentence
showing_results_but_no_showing <- sub(".* of ", "", showing_results) # Get rid of everything after the word 'of'
max_number <- parse_number(showing_results_but_no_showing) # Extract the integer

num_offsets <- max_number - (max_number %% 20) # Make it a multiple of 20

offset_values <- seq(0, num_offsets, by = 20) # Generate a sequence of multiples of 20s to the limit

unitedata<- function(x) {
  full_url <- paste0(url, x)
  full_url
}

finalurl <- unitedata(offset_values) # Create all the URLs with different offset values that we will scrape from
Great – so now we have all the URLs that we will visit and scrape the information. The world is almost our oyster, so what information shall we scrape here? I chose to scrape the professor’s name, subject, and RMP URL. Here we go:
rmp_scrape_for_links <- function(x) {
  page <- x
  name <- page %>% read_html() %>% html_nodes('.main') %>% html_text() %>% as.data.frame(stringsAsFactors = FALSE)
  url <- page %>% read_html() %>% html_nodes('.PROFESSOR a') %>% html_attr('href') %>% as.data.frame(stringsAsFactors = FALSE)
  subject <- page %>% read_html() %>% html_nodes('.sub') %>% html_text() %>% as.data.frame(stringsAsFactors = FALSE)

  # Combine the features, name them, return them, then rest :)
  links <- cbind(name, url, subject)
  names(links) <- c("Name", "URL", "Subject")
  return(links)
  Sys.sleep(5)
}

professor_links <- map_df(finalurl, rmp_scrape_for_links)
Our professor_links dataframe looks pretty messy right now…
|
Name
<chr>
|
URL
<chr>
|
Subject
<chr>
|
|---|---|---|
| Stagliano, | /ShowRatings.jsp?tid=125537 | Illinois Institute of Technology, Science |
| Poros, | /ShowRatings.jsp?tid=495895 | Illinois Institute of Technology, Sociology |
| Saniie, Jafar | /ShowRatings.jsp?tid=54696 | Illinois Institute of Technology, Engineering |
… but after a bit of cleanup…
first_name <- sub(".*,", "", professor_links$Name) # extract first name
last_name <- sub(",.*", "", professor_links$Name) # extract last name
professor_links$Name <- paste(first_name, last_name) # marry the two
professor_links$Name <- trimws(professor_links$Name) # kill the whitespace
professor_links$URL <- paste0("http://www.ratemyprofessors.com", professor_links$URL) # make it a full url
professor_links$Subject <- sub(".*, ", "", professor_links$Subject) # trim the school name from the subject
professor_links <- unique(professor_links) # remove duplicates
professor_links <- as.tibble(professor_links) # i like tibbles :)
… our professor_links dataframe finally looks nice and tidy:
|
Name
<chr>
|
URL
<chr>
|
Subject
<chr>
|
|---|---|---|
| Stagliano | http://www.ratemyprofessors.com/ShowRatings.jsp?tid=125537 | Science |
| Poros | http://www.ratemyprofessors.com/ShowRatings.jsp?tid=495895 | Sociology |
| Jafar Saniie | http://www.ratemyprofessors.com/ShowRatings.jsp?tid=54696 | Engineering |
| … | … | … |
Our objective is now clear: copy and paste what we just did above with our web scrapper and use it again to get individual ratings for each of the URLs in our dataframe. Sounds simple, but here comes a classic 🚨🚨🚨 ‘uh-oh, I don’t have that much time to run a web-scrapper for hundreds and hundreds of professors’ moment 🚨🚨🚨. So, as a simple example, I filtered the list to only show me professors in my department (Computer Science), which still took about a minute to run:
full_subject_name <-"Computer Science"
abbreviated_subject_name <- "CS"

cs_professors <- professor_links %>%
  filter(Subject == full_subject_name)
In this current implementation, there is a glaring issue – for each professor, the maximum number of reviews we can scrape is capped at 20. I could not figure out how to scrape any more without telling the website to load more reviews – perhaps a future update to this blog post can address this issue. Regardless, the most-recent 20 reviews for a single professor ensures that many reviews are not incredibly old (as both professors’ teaching styles and their courses change quite a bit over many years) and that newer reviews are prioritized, as they should be.

rmp_scrape_for_ratings <- function(x) {
  page <- x
  name <- page %>% read_html() %>% html_nodes('.profname') %>% html_text() %>% as.data.frame(stringsAsFactors = FALSE)
  course <- page %>% read_html() %>% html_nodes('.name .response') %>% html_text() %>% as.data.frame(stringsAsFactors = FALSE)
  rating <- page %>% read_html() %>% html_nodes('.rating-type') %>% html_text() %>% as.data.frame(stringsAsFactors = FALSE)
  overall_quality <- page %>% read_html() %>% html_nodes('.break:nth-child(1) .score') %>% html_text() %>% as.data.frame(stringsAsFactors = FALSE)
  difficulty_level <- page %>% read_html() %>% html_nodes('.inverse') %>% html_text() %>% as.data.frame(stringsAsFactors = FALSE)
  comments <- page %>% read_html() %>% html_nodes('.commentsParagraph') %>% html_text() %>% as.data.frame(stringsAsFactors = FALSE)
  name_rep <- rep(name$.[1], nrow(rating))

  if (length(name_rep) == 0 || nrow(course) == 0 || nrow(rating) == 0 || nrow(overall_quality) == 0 || nrow(difficulty_level) == 0 || nrow(comments) == 0) {
    return() # no empty dataframes!
  }

  # combining, naming, classifying our variables
  ratings <- cbind(name_rep, course, rating, overall_quality, difficulty_level, comments)
  ratings[] <- lapply(ratings, as.character)
  names(ratings) <- c("Name", "Course", "Rating", "Quality", "Difficulty", "Comments")
  return(ratings)
  Sys.sleep(5)
}

professor_ratings <- map_df(cs_professors$URL, rmp_scrape_for_ratings)
Slight issue aside, the dataframe we just scraped together is definitely a bit messy. One particular issue I found was with the course – some included a “CS” in front, others were reviews for a single course, some two courses combined in one review, and some just said the full course name with no abbreviations (which is more work than just writing a number in my opinion).
|
Name
<chr>
|
Course
<chr>
|
Rating
<fctr>
|
Quality
<dbl>
|
Difficulty
<dbl>
|
Comments
<chr>
|
|---|---|---|---|---|---|
| \r\n David \r\n Grossman\r\n \r\n | DATAMINING | good | 4.0 | 5.0 | \r\n No Comments\r\n |
| \r\n Michael \r\n Lee\r\n \r\n | CS331CS350 | awful | 1.0 | 5.0 | \r\n Isn’t clear whatsoever about grades, assignments, lectures and much more. Overall, bad teacher.\r\n |
| \r\n Irina \r\n Matveeva\r\n \r\n | CS422CS522 | awesome | 4.5 | 2.0 | \r\n Teaching and motivations are just amazing… opens up goods opportunities fpr students through guests from industry and real projects…\r\n |
| … | … | … | … | … | … |
It’s a bit crude, but the code below cleans up the dataframe as best as possible in a completely automated sense. To address the weird course issue, I mark all non-CS or non-number-having course as “Other” (if a CS professor teaches a non-CS course, I decide to ignore it for now), strip all of the courses to just numbers, split six-digit numbers (AKA two courses reviewed in one) as two separate courses with the same review, and make it all pretty. The code below does a much better job explaining it than me.
professor_ratings$Name <- gsub("\r\n ", "", professor_ratings$Name) # get rid of \r\n in the name
professor_ratings$Name <- trimws(professor_ratings$Name) # trime whitspace
professor_ratings$Comments <- gsub("\r\n ", "", professor_ratings$Comments) # ditto for the comments
professor_ratings$Comments <- trimws(professor_ratings$Comments) # ditto ditto
professor_ratings$Rating <- as.factor(professor_ratings$Rating) # make rating a factor
professor_ratings$Quality <- as.numeric(professor_ratings$Quality) # make quality a numeric
professor_ratings$Difficulty <- as.numeric(professor_ratings$Difficulty) # make difficulty a numeric

numbers_only <- function(x) !grepl("\\D", x) # a fun regular expression to make sure a string is numbers only

# Okay, time to clean up the courses. First, we make sure that the course has a number in it AND it is either 1) strictly numbers or 2) has the word "CS" in it
# If these conditions are true, keep it as is, if not, replace it with 0 (which will represent our "Other" category)
professor_ratings$Course <- ifelse(grepl("\\d", professor_ratings$Course) & (numbers_only(professor_ratings$Course) | grepl(abbreviated_subject_name, professor_ratings$Course)), professor_ratings$Course, 0)
professor_ratings$Course_Number <- parse_number(professor_ratings$Course) # parse the number from the course into a new column, `Course_Number`
professor_ratings$Course_Number <- abs(professor_ratings$Course_Number) # take the absolute value of that number

two_courses <- professor_ratings %>%
  filter(Course_Number > 999 & Course_Number >= 100000 & Course_Number <= 999999) # capture reviews with two courses attached (six digits total)
two_courses$Course_Number <- as.numeric(as.character(substr(two_courses$Course_Number, 3, 6))) # just get the last three-digit course

professor_ratings$Course_Number <- as.numeric(as.character(substr(professor_ratings$Course_Number, 1, 3))) # just get the first three-digit course
# If the course number is less than 100, it doesn't exist at Illinois Tech. This is a section number usually, so throw it out!
professor_ratings$Course_Number <- ifelse(professor_ratings$Course_Number < 100, 0, professor_ratings$Course_Number)
professor_ratings$Course_Number <- ifelse(professor_ratings$Course_Number == 0, "Other", professor_ratings$Course_Number) # make the "Other" category official
professor_ratings <- rbind(professor_ratings, two_courses) # combine the two :)

professor_ratings <- as.tibble(unique(professor_ratings)) # i still like tibbles
Finally, oh finally, we have clean data:
|
Name
<chr>
|
Course
<chr>
|
Rating
<fctr>
|
Quality
<dbl>
|
Difficulty
<dbl>
|
Comments
<chr>
|
Course_Number
<chr>
|
|---|---|---|---|---|---|---|
| Michael Lee | CS331CS350 | awful | 1.0 | 5 | Isn’t clear whatsoever about grades, assignments, lectures and much more. Overall, bad teacher. | 331 |
| Michael Lee | CS331CS350 | awful | 1.0 | 5 | Isn’t clear whatsoever about grades, assignments, lectures and much more. Overall, bad teacher. | 350 |
| Kyle C Hale | CS350 | awesome | 5.0 | 4 | I’ve never written here about any prof, but Prof. Hale is one of those profs who teach exactly what you need… | 350 |
| … | … | … | … | … | … | … |
Let the analysis begin.
Looking at the Best and Worst Courses
This task initially stumped me. If a class has a single negative review with quality 1.0 and another class has three negative reviews with quality 1.5, which class is worse? I believe the latter, but how can we quantify this? The answer is, actually, IMDb, believe it or not.
Applying this true ‘Bayesian estimate’ formula to our CS professor reviews, we can conclude that the highest-reviewed (and lowest-reviewed) CS course at Illinois Tech are…
weighted_rankings_df <- tibble(Department = character(), Course = character(), Ranking = character())

for (course in sort(unique(professor_ratings$Course_Number))) {
  course_ratings <- professor_ratings %>%
    filter(Course_Number == course)

  min_votes <- floor(nrow(professor_ratings) / length(unique(professor_ratings$Course_Number)))
  num_votes <- nrow(course_ratings)
  course_average <- mean(course_ratings$Quality)
  department_average <- mean(professor_ratings$Quality)

  # (WR) = (v ÷ (v+m)) × R + (m ÷ (v+m)) × C
  weighted_rating <- (num_votes / (num_votes + min_votes)) * course_average + (min_votes / (num_votes + min_votes)) * department_average

  # add results to dataframe to look at later
  weighted_rankings_df <- rbind(weighted_rankings_df, tibble(Department = abbreviated_subject_name, Course = course, Ranking = round(weighted_rating, 2)))

  cat(paste("Weighted Quality Rating for", abbreviated_subject_name, course, "is", round(weighted_rating, 2), "\n"))
}

worst_course <- weighted_rankings_df %>%
  filter(Ranking == min(weighted_rankings_df$Ranking))

best_course <- weighted_rankings_df %>%
  filter(Ranking == max(weighted_rankings_df$Ranking))
CS 595 👍 and CS 553 👎, respectively.
Just taking a look at the reviews table for these courses shows that this isn’t too hard to believe…
worst_course_full <- professor_ratings %>%
  filter(Course_Number %in% worst_course$Course)

best_course_full <- professor_ratings %>%
  filter(Course_Number %in% best_course$Course)
|
Name
<chr>
|
Course
<chr>
|
Rating
<fctr>
|
Quality
<dbl>
|
Difficulty
<dbl>
|
Comments
<chr>
|
Course_Number
<chr>
|
|---|---|---|---|---|---|---|
| Ioan Raicu | CS553 | awful | 1 | 5 | Professor Ioan is by far the worst professor that I have taken at CS and that’s saying something. Terrible communicate… | 553 |
| Ioan Raicu | CS553 | awful | 1 | 5 | There will be general 3 program assignments and a big project this semester, but actually he delayed second program assignment that leads to a rush in the final semester…. | 553 |
| Ioan Raicu | CS553 | awful | 1 | 5 | I would rate this professor 0/5 if I can, avoid him at any rate especially those who enjoy this field in computer science… | 553 |
| … | … | … | … | … | … | … |
… compared with…
|
Name
<chr>
|
Course
<chr>
|
Rating
<fctr>
|
Quality
<dbl>
|
Difficulty
<dbl>
|
Comments
<chr>
|
Course_Number
<chr>
|
|---|---|---|---|---|---|---|
| Kyle C Hale | CS595 | awesome | 5 | 4 | I would say he is the best and coolest Professor I have never met in IIT. Knowledgeable, skillful, programming assignment is not trivial, but he always explains everything… | 595 |
| Kyle C Hale | CS595 | awesome | 5 | 5 | If you Want to build an Operating System or would like to you should take his class. | 595 |
| Kyle C Hale | CS595 | awesome | 5 | 4 | Coolest professor ever. Research oriented, very highly skilled..!! | 595 |
| … | … | … | … | … | … | … |
And to think I almost took CS 553…
Average Course Quality Rating
Alright, I’m finally ready to answer the big-momma question: are a majority of the RateMyProfessor reviews inherently negative or positive (I guess specifically in the Illinois Tech CS department for starters). A very simple bar plot below shows that, actually…
professor_ratings %>%
  ggplot(aes(x = as.factor(Quality), fill = as.factor(Quality))) +
    geom_bar(width = 0.95) +
    scale_fill_brewer(palette = "RdYlGn") +
    theme(legend.position = "none") +
    labs(title = paste0("Quality of ", abbreviated_subject_name, " Courses"),
         x = "Quality",
         y = "Count") +
    geom_vline(aes(xintercept = mean(Quality)), col = 'black', linetype = "dashed")

average_quality <- mean(professor_ratings$Quality)
median_quality <- median(professor_ratings$Quality)
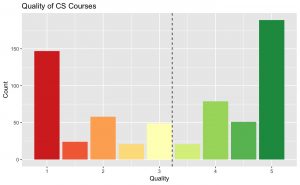
Even though I’ve already made my point that it’s not all negative with an average quality of 3.23 and median even higher (AKA they’re not mostly negative at all), it’s hard to summarize an entire course’s worth of thoughts into a single number. The most useful part of RMP’s system is the extensive comments reviewers leave for each course. If only there was a way to do some sort of “sentiment analysis” on the comments or something…
RMP Comments, meet NLP
Yup – let’s do this. I’m no NLP-expert, I truly only have experience working with Stanford’s CoreNLP package, but since the installation is inherently broken on macOS architecture, I’ll be going with an alternative: sentimentr, which is an effective augmented dictionary lookup to determine a numerical sentiment for a sentence. The more negative a rating is, the more negative the sentiment. For example,
library(sentimentr)

"I was born with glass bones and paper skin. Every morning I break my legs, and every afternoon I break my arms. At night, I lie awake in agony until my heart attacks put me to sleep." %>% sentiment()
… results in…
|
sentence_id
<int>
|
word_count
<int>
|
sentiment
<dbl>
|
|---|---|---|
| 1 | 9 | 0.0000000 |
| 2 | 13 | -0.1386750 |
| 3 | 15 | -0.3872983 |
… while happier sentences such as…
"F is for frolic through all the flowers. U is for ukulele. N is for nose picking, sharing gum, and sand licking, here with my best buddy." %>% sentiment()
|
sentence_id
<int>
|
word_count
<int>
|
sentiment
<dbl>
|
|---|---|---|
| 1 | 8 | 0.1767767 |
| 2 | 4 | 0.0000000 |
| 3 | 15 | 0.387298 |
You can read more about the package on its Github here.
Throwing all of the comments extracted for CS courses at Illinois Tech into the semantic analysis and plotting it shows…
…
…
…
… exactly the same results as the quality – most reviews truly are more positive than negative. I know – it’s almost unbelievable!
comment_sentiments <- sentiment(professor_ratings$Comments)

comment_sentiments %>%
  ggplot(aes(x = sentiment, fill = as.factor(round(sentiment, 0)))) +
    geom_histogram(bins = 25, alpha = 0.8) +
    scale_fill_brewer(palette = "RdYlGn") +
    theme(legend.position = "none") +
    labs(title = paste0("Sentiment Analysis for ", abbreviated_subject_name, " Courses"),
         x = "Sentiment",
         y = "Count") +
    geom_vline(aes(xintercept = mean(sentiment)), col = 'black', linetype = "dashed")

average_sentiment <- mean(comment_sentiments$sentiment)

median_sentiment <- median(comment_sentiments$sentiment)
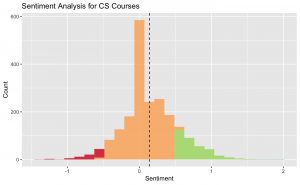
As a little bonus, I’ve included the exact sentiment analysis breakdown for each and every comment extracted for this analysis – it’s very pretty to look at and worth a read if you’d like a quick chuckle reading about students suffering in class for a semester. You can read that here (and I could not recommend reading it more).
Conclusion
It took about a day’s work, but I think our conclusions are valid in this small, controlled sample: RateMyProfessor reviews are not inherently more negative than positive, in both quality rating and comment sentiment (and also CS 553 is perhaps not the best course at Illinois Tech). To the interested reader out there, download the full source code (found right below this) and try it out with your school and your department and see what you get! The answers may surprise you!
So the next time your friend decides to take a course without reading the reviews because they are convinced the reviews are disproportionately negative, you might want to send them this post first. They’ll thank you later.
Enough CS – How about the entire school?! Update (as of 1/26/19)
Alright, fine. You asked – I listened. How about this same analysis for every course at Illinois Tech?
Deal.
The source code is just about the same thing – run the scrapper for a very long time to get every review (not just for those CS professors), run just about the same cleaning for all general courses, and let it run! Here’s what we get:
Using the same true ‘Bayesian’ rating system as before, our lowest-rated course is STILL CS 553, Cloud Computing, with a score of 1.92 (mega-ouch) and the best course being HUM 380, Topics in Humanities (as someone who has taken a HUM 380 course, yes, this sounds about right). Let’s inspect some of these reviews together then, shall we:
|
Name
<chr>
|
Course
<chr>
|
Rating
<fctr>
|
Quality
<dbl>
|
Difficulty
<dbl>
|
Comments
<chr>
|
Course_Number
<chr>
|
|---|---|---|---|---|---|---|
| Ioan Raicu | CS553 | awful | 1 | 5 | Professor Ioan is by far the worst professor that I have taken at CS and that’s saying something. Terrible communicate both verbally and written. His exams are very difficult and very unreasonable. He barely does one example of each calculation and will not go back to previous days material. He teaches the class as if you should already know this… | 553 |
| Ioan Raicu | CS553 | awful | 1 | 5 | There will be general 3 program assignments and a big project this semester, but actually he delayed second program assignment that leads to a rush in the final semester… | 553 |
| Ioan Raicu | CS553 | awful | 1 | 5 | I would rate this professor 0/5 if I can, avoid him at any rate especially those who enjoy this field in computer science. Too many tests, pop quiz, talk more than do. If you plan to take this professor’s course, be careful, there will be dragon. Choose other professor instead. | 553 |
| … | … | … | … | … | … | … |
… vs. …
|
Name
<chr>
|
Course
<chr>
|
Rating
<fctr>
|
Quality
<dbl>
|
Difficulty
<dbl>
|
Comments
<chr>
|
Course_Number
<chr>
|
|---|---|---|---|---|---|---|
| Glenn Broadhead | HUM380 | awesome | 5.0 | 1 | I would reccomend Broadhead. He is a very kind grader and is also friendly and funny in class. I learned a lot through videos he put on. The only assignments were a 5 page and 10 page paper and a presentation at the end. | 380 |
| Catherine Bronson | HUM380 | awesome | 5.0 | 1 | Awesome class, awesome professor, very interesting topic. One or two essays, open book exams are easy if you’ve paid attention to interesting class discussion. | 380 |
| Teresa Moreno | HUM380 | awesome | 4.5 | 1 | Good teacher. Really interested in women’s issues and will make you think. If you show up and do the work you’ll get a good grade. | 380 |
| … | … | … | … | … | … | … |
As a CS major, this definitely worries me.
Looking again at our plots, we see that, actually, the quality of Illinois Tech courses are well above average, the average difficulty is right in the sweet-spot, and even the semantic analysis of our RateMyProfessor comments are still showing more positives than negatives!
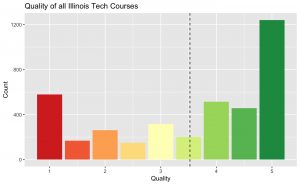
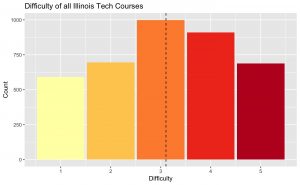
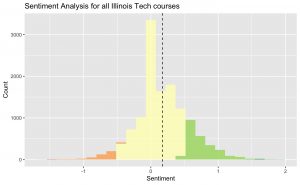
So now, school-wide, I think I’ve definitively made the case for RateMyProfessor!
Full source code with exciting bonus features can be found here. A direct link to donate me money via hiring me for a job can be found here.
